Image Analysis
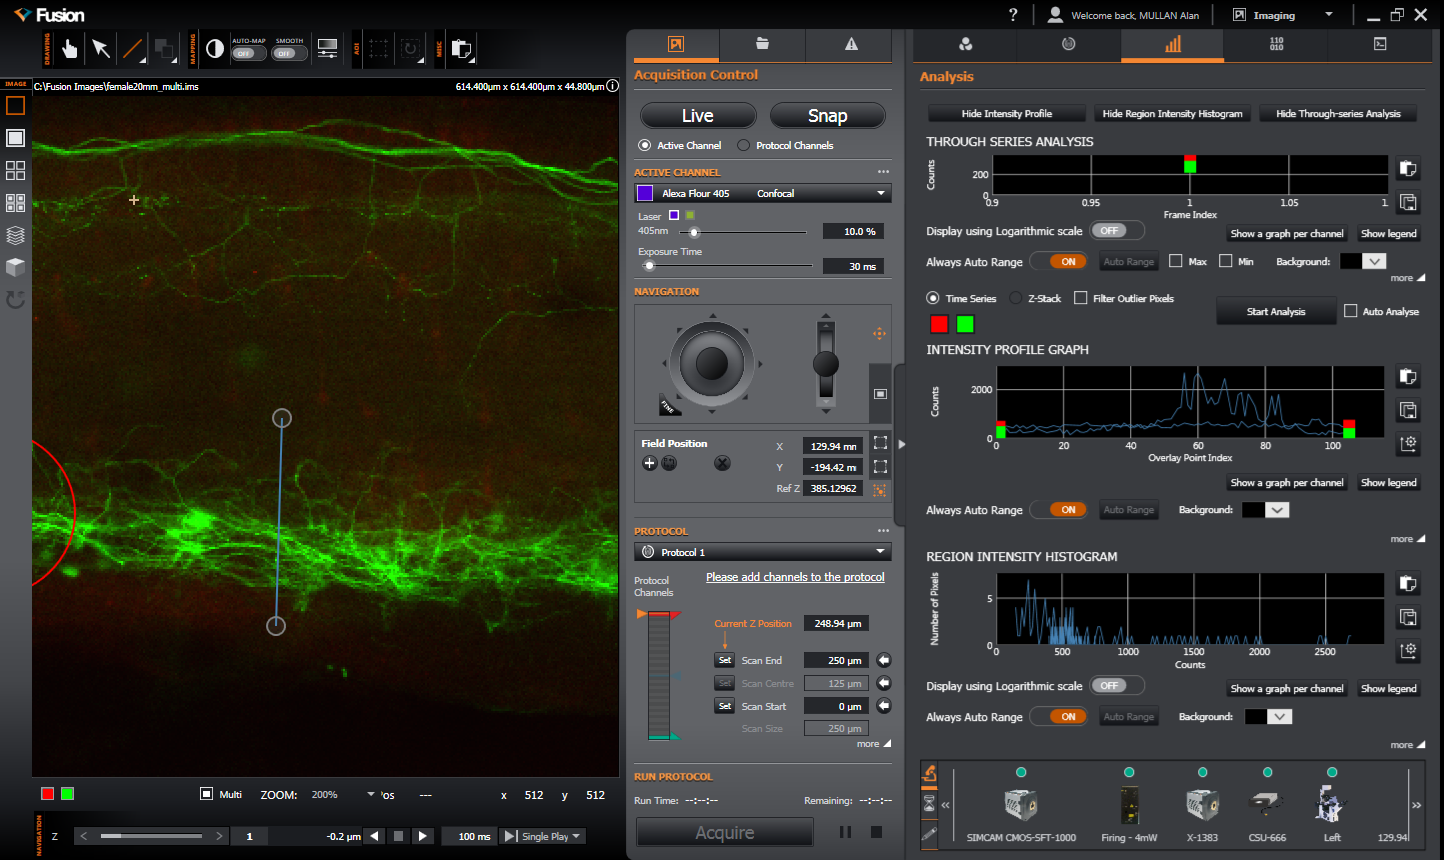
Once you have acquired and visualised your image as shown in the Image Acquisition and Image Visualisation topics you may analyse the image data further. This section covers topics relating to the image analysis including how to use overlays and functions of the Analysis panel. An overview of the Image Analysis panel is given at Analysis Tab.

This section covers the following topics:
| Analysis Overlays | How to use overlays for image analysis |
| Intensity Profile Graph | How to view an Intensity profile graph or data table and export data |
| Region Intensity Histogram | How to view an Region Intensity Histogram or data table and export data |
| Through-series Analysis | How to perform through series analysis and export data |
To view how to open, save or manage image data files refer to the File Management section.