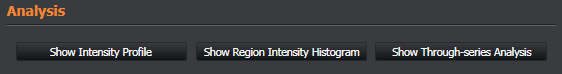
The analysis tab provides a range of options for analysis of your image data.
Your data to be viewed in the following ways:
|
Show Intensity Profile |
Toggles the display of an intensity line profile view of the selected overlay for the current image data |
|
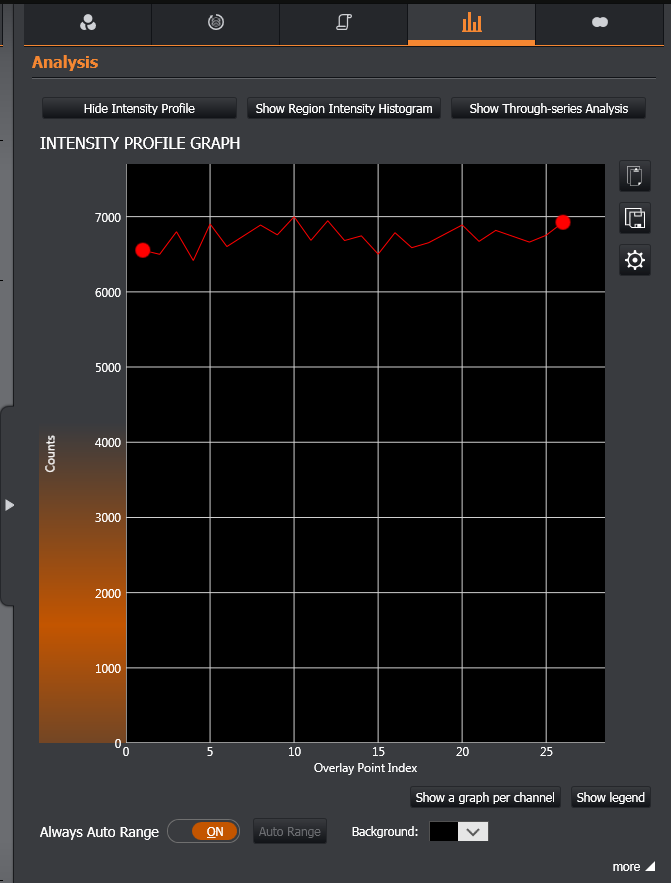
Show Region Intensity Histogram |
Toggles the display of an Intensity histogram view of the current image data |
|
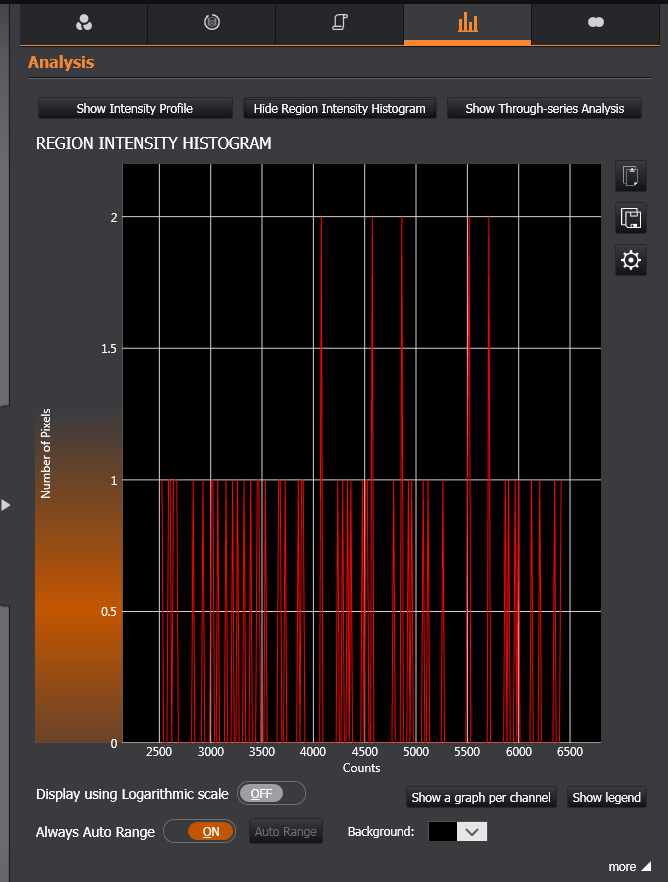
Show Through-series Analysis |
Toggles the display of a through-series analysis view of the current image data |
The following options are available:
|
Export Graph view to Clipboard |
Exports the current view of the graph to the clipboard. |
|
Export graph view to an image file |
Export the current view of the graph as an image file in the following formats: JPG, Bitmap, PNG. |
|
Adjust Axes |
Manually adjust the scale of the x and y axes to best match your data. |
Intensity Profile Graph
-
Always Auto Range: When Always Auto Range is enabled, the scale of the axes will continuously adjust to best match the current data.
-
Auto Range: Use the one touch auto range button to perform a one off auto range for the current graph.
-
Background: Set the background colour of the graph from the available colour palette options.
-
Show a graph per channel/Show one graph for all channels: Choose whether to view data for each channel on separate graphs or combined in one graph view.
-
Show/Hide Legend: Show or hide the legend for the graph.
-
more: View the Intensity profile data in tabular format.
-
Copy to Clipboard: Copy the data (including metadata) to the clipboard
-
Export to File: Export the data (including metadata) as a CSV file.
-
Region Intensity Histogram
-
Display using Logarithmic scale: Set the y-axis to logarithmic format.
-
Always Auto Range: When Always Auto Range is enabled, the scale of the axes will continuously adjust to best match the current data.
-
Auto Range: Use the one touch auto range button to perform a one off auto range for the current graph.
-
Background: Set the background colour of the graph from the available colour palette options.
-
Show a graph per channel/Show one graph for all channels: Choose whether to view data for each channel on separate graphs or combined in one graph view.
-
Show/Hide Legend: Show or hide the legend for the graph.
-
more: View the Region Intensity Histogram Statistics and Data in tabular format
-
Copy to Clipboard: Copy the data (including metadata) to the clipboard
-
Export to File: Export the data (including metadata) as a CSV file.
-
Through Series Analysis
-
Display using Logarithmic scale: Set the y-axis to logarithmic format.
-
Always Auto Range: When Always Auto Range is enabled, the scale of the axes will continuously adjust to best match the current data.
-
Auto Range: Use the one touch auto range button to perform a one off auto range for the current graph.
-
Max/Min: Plot a through series for the frame Max and Min values
-
Background: Set the background colour of the graph from the available colour palette options.
-
Show a graph per channel/Show one graph for all channels: Choose whether to view data for each channel on separate graphs or combined in one graph view.
-
Show/Hide Legend: Show or hide the legend for the graph.
-
more: View the through series analysis data in tabular format
-
Time Series: View the data as a time series
-
Z-stack: View the data as a graph of the Z-stack.
-
Filter Outlier Pixels: Check the box to filter pixels within the top and bottom 1% of intensity from the data.
-
Start Analysis: Start analysis for the currently selected options
-
Auto Analyse: Check the box to automatically analyse data and update the graph as options are changed.