Intensity Profile
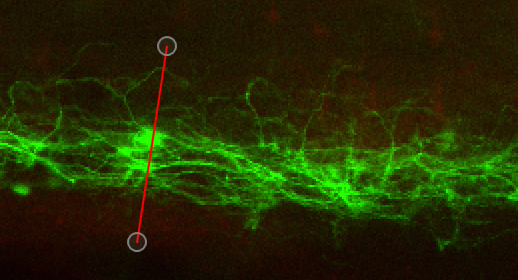
This topic shows you how to create an intensity profile data as a graph or table, and how to use the options to adjust the display of the image data. Using a line overlay- as shown in Adding an Overlay, you can view the intensity profile over an area.
- Select the required overlay in the area of interest.

- Check that Show Intensity Profile is selected.
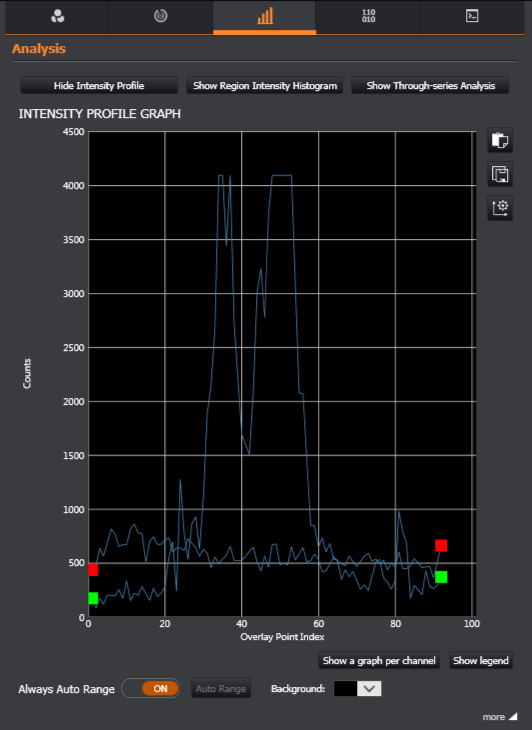
- The Intensity Profile graph is displayed.

Above: Intensity profile graph showing both channels displayed in a single graph.
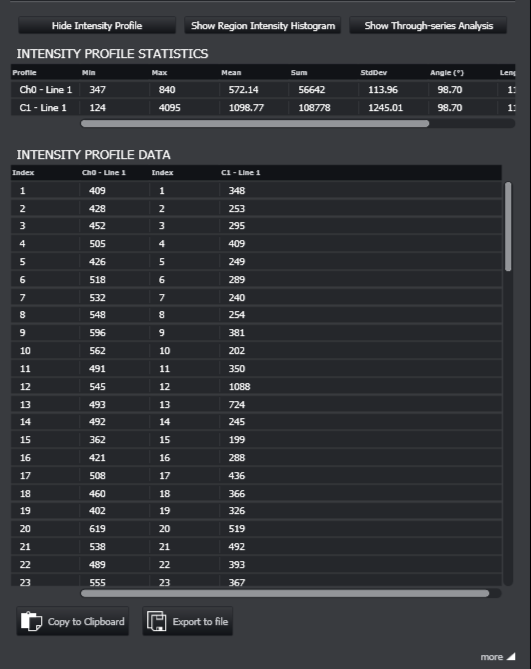
To view the data as a table, click the more button (bottom right).

Viewing Options
You can move the overlay and the data will automatically update to reflect the changes. There are a number of options for viewing the image data in the intensity profile graph. You can change how the data is displayed in the following ways:
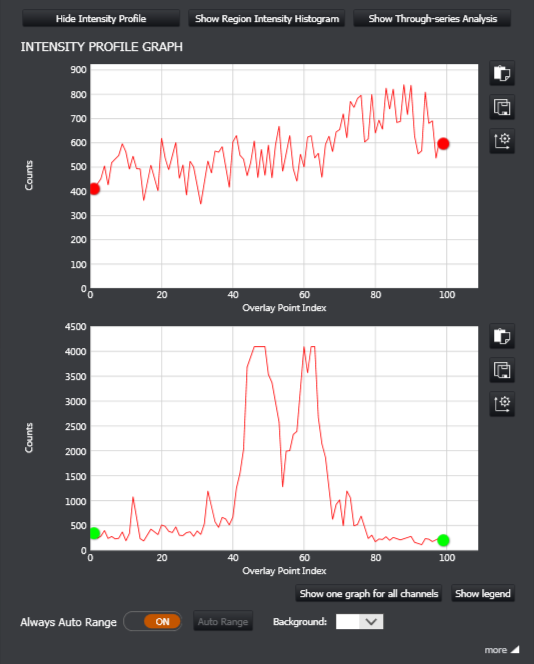
Show a graph per channel: this shows a separate graph for each channel used in the image.
Show legend: this shows a legend beside the graph(s) for each channel.
Always Auto Range: Automatically scales the graph based on the data. When this is disabled you can use the mouse buttons to pan and zoom the scale and the graph plot. Auto Range can also be used in manual display mode to do a single-shot scale to fit data.
Background: Change the background colour for the graph from the palette and advanced colour options.
Adjust Graph Axes: This button enables min and max values for the X and Y axes to be entered.

Above: Intensity profile graph with both channels displayed as separate graphs and background colour changed from the default settings.
Exporting the Graph and Data
There are two options for exporting the graph from the Intensity profile graph. With the graph displayed the export buttons are located to the top right:
Export graph view to clipboard: Useful for pasting the graph into another document.
Export graph view to an image file: For saving the graph as an image file (jpg, png or bmp formats).
To export the data, click the more button to view the data as a table.
Copy to clipboard: Useful for pasting the data (and image metadata) into an other document e.g. Excel document
Export to file: For saving the data as a .csv file for use in other applications.