This section shows you how to use and work with overlays. Overlays can be used to set an area for use in the Analysis panel. Examples of image analysis options are shown in the topics Intensity Profile, Region Intensity Histogram and Through Series Analysis.
This includes the following topics:
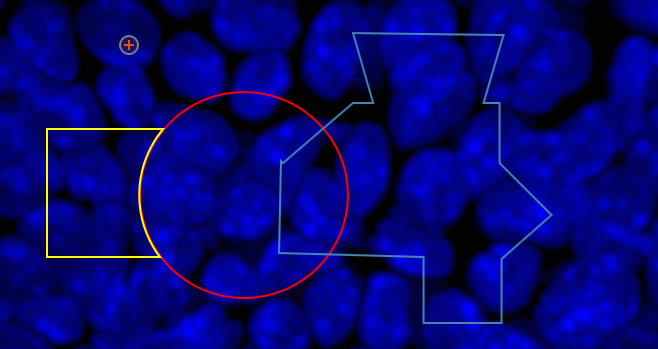
| Adding an Overlay |
How to create an overlay. |
| Manipulating Overlays |
How to manipulate overlays- combining, subtracting and intersecting. |